

Data Visualization#
In this example, we adapt the code from the MatPlotAgent paper.
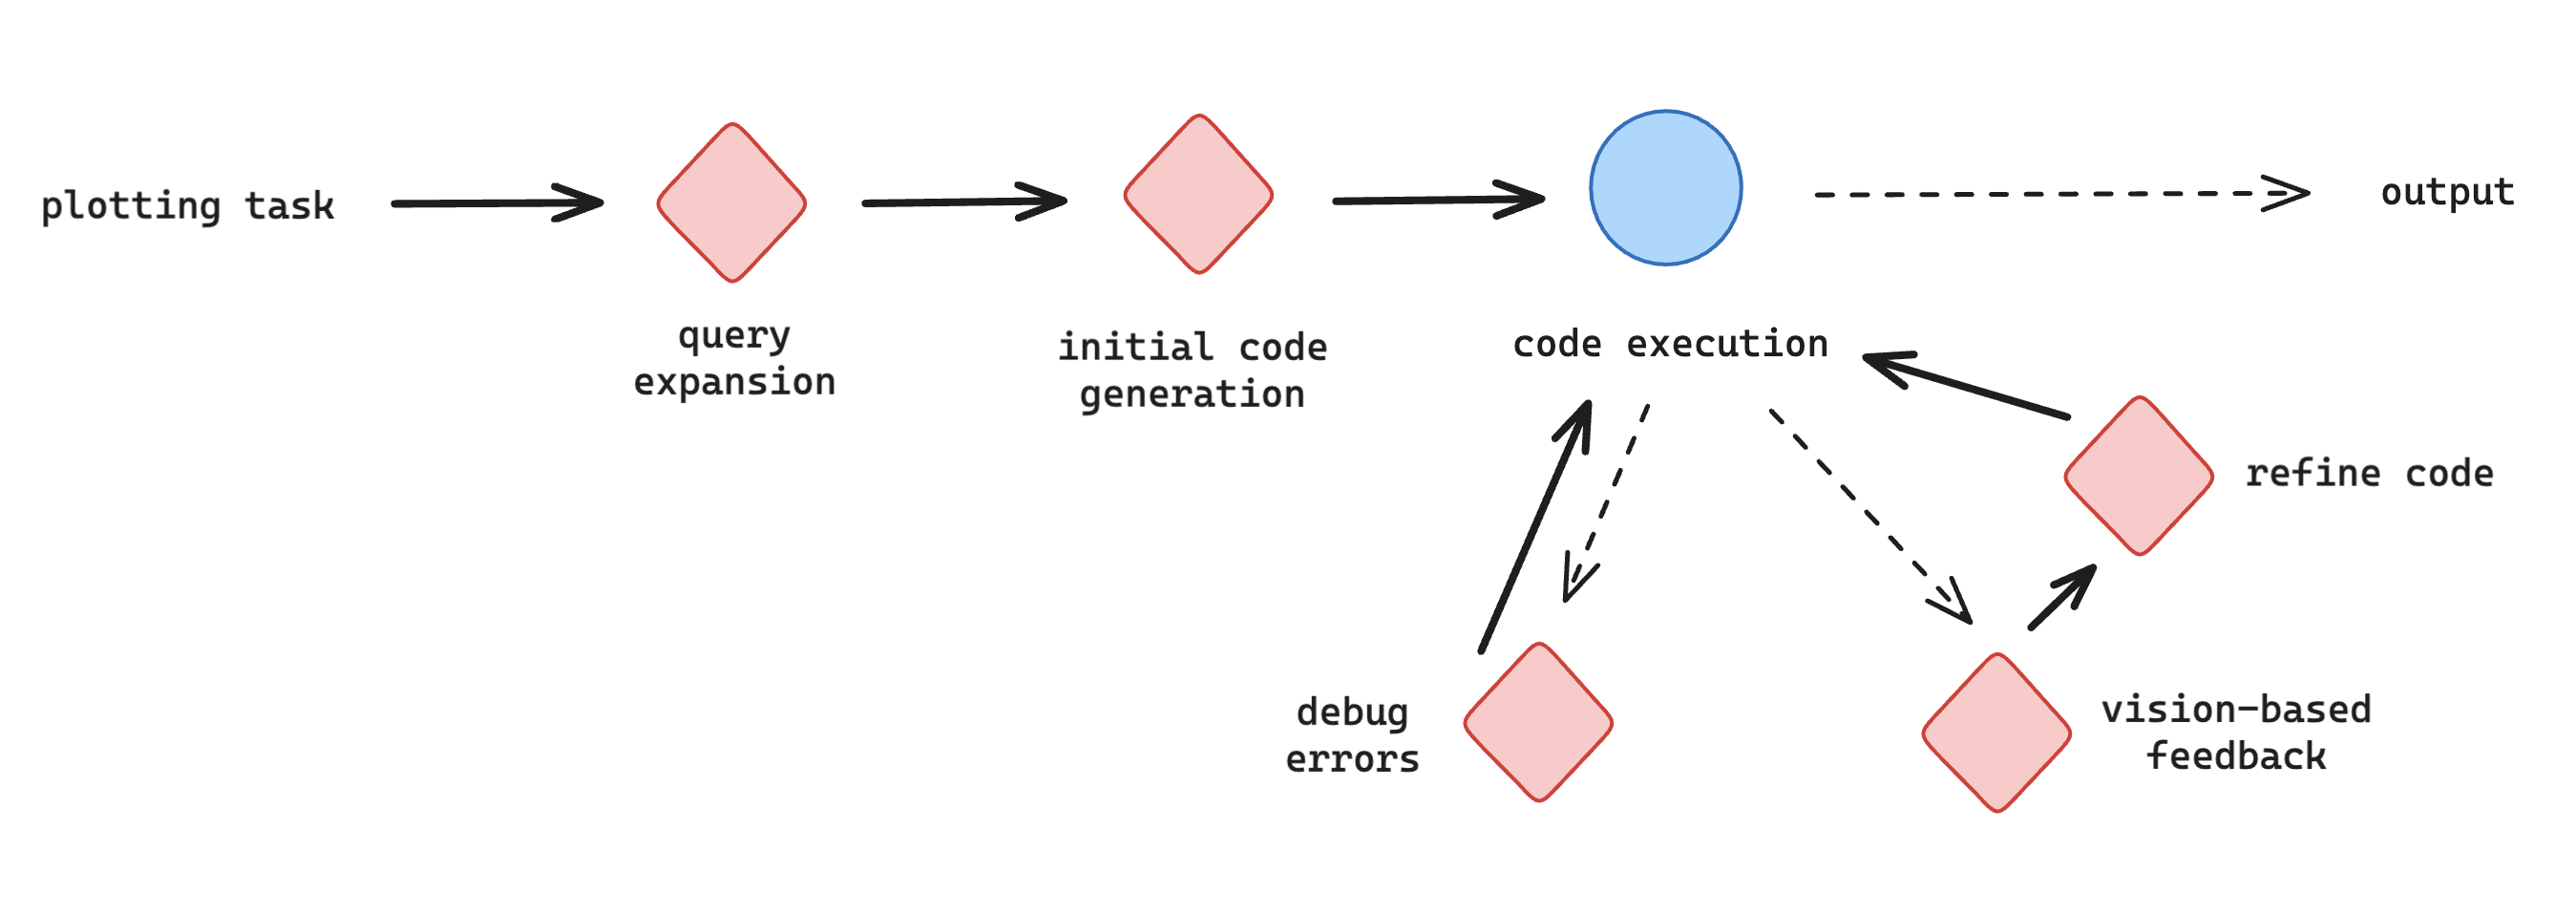
The workflow is as follows:
Query expansion adds more information or context regarding the user’s task
Initial code generation generates plotting code based on the provided context
Code execution runs the code in a sandbox
If the program has errors, it goes to a debugging agent, which will refine the code to remove errors and send it back for execution
If the program does not have errors, it goes to a vision feedback agent that will provide feedback on the output plot. This feedback is then used to refine the code.
Lastly, the refined code is executed and the final output image is generated.
Data Loader#
We use the benchmarking data provided by the paper, which you can download here. For convenience, we’ve already split the dataset into train and test. You can find the exact splits in the ./benchmark_split/ folder.
The dataset contains CSVs as data sources, instructions to generate a specific plot from a given data source, and ground-truth images. The workflow creates a temporary workspace for the sandbox. Hence, the input provides a query (instruction), directory_path (sandbox), example_id and input_path which are used to reference the training data and create the results folder. The ground_truth simply references the ground truth image.
import cognify
import json
import numpy as np
import os

@cognify.register_data_loader
def load_data():
    def load_from_file(input_file):
        # open the json file
        data = json.load(open(input_file))

        all_data = []
        for item in data:
            novice_instruction = item['simple_instruction']
            example_id = item['id']
            directory_path = f'opt_runs'

            if not os.path.exists(directory_path):
                os.makedirs(directory_path, exist_ok=True)

            input = {
                'query': novice_instruction,
                "directory_path": directory_path,
                "example_id": example_id,
                "input_path": f'benchmark_data/data/{example_id}',
            }
            label = {"ground_truth": f"benchmark_data/ground_truth/example_{example_id}.png"}
            all_data.append((input, label))
        return all_data

    all_train = load_from_file('benchmark_split/train_data.json')
    test_data = load_from_file('benchmark_split/test_data.json')
    train_indices = np.random.choice(range(len(all_train)), 40, replace=False).tolist()
    eval_indices = list(set(range(len(all_train))) - set(train_indices))

    train_data = [all_train[i] for i in train_indices]
    eval_data = [all_train[i] for i in eval_indices]
    return train_data, eval_data, test_data
Evaluator#
The evaluator calls GPT-4o to score the output with respect to the ground truth image.
from openai import OpenAI
import warnings
import re
import base64

BASE_URL='https://api.openai.com/v1'
import dotenv
dotenv.load_dotenv()
API_KEY = os.environ["OPENAI_API_KEY"]


def encode_image(image_path):
    with open(image_path, "rb") as image_file:
        return base64.b64encode(image_file.read()).decode('utf-8')

@cognify.register_evaluator
def gpt_4o_evaluate(ground_truth, image, rollback):
    client = OpenAI(
        api_key=API_KEY,
        base_url=BASE_URL,)
    if not os.path.exists(f'{image}'):
        if os.path.exists(f'{rollback}'):
            base64_image1 = encode_image(f"{ground_truth}")
            base64_image2 = encode_image(f"{rollback}")
        else:
            image = 'benchmark_data/ground_truth/empty.png'
            base64_image1 = encode_image(f"{image}")
            base64_image2 = encode_image(f"{image}")
    else:
        base64_image1 = encode_image(f"{ground_truth}")
        base64_image2 = encode_image(f"{image}")

    response = client.chat.completions.create(
      model="gpt-4o",
      temperature=0.0,
      messages=[
        {
          "role": "user",
          "content": [
            {
              "type": "text",
              "text": f'''You are an excellent judge at evaluating visualization plots between a model generated plot and the ground truth. You will be giving scores on how well it matches the ground truth plot.

               The generated plot will be given to you as the first figure. If the first figure is blank, that means the code failed to generate a figure.
               Another plot will be given to you as the second figure, which is the desired outcome of the user query, meaning it is the ground truth for you to reference.
               Please compare the two figures head to head and rate them.
               Suppose the second figure has a score of 100, rate the first figure on a scale from 0 to 100.
               Scoring should be carried out in the following aspect:
               1. Plot correctness:
               Compare closely between the generated plot and the ground truth, the more resemblance the generated plot has compared to the ground truth, the higher the score. The score should be proportionate to the resemblance between the two plots.
               In some rare occurrence, see if the data points are generated randomly according to the query, if so, the generated plot may not perfectly match the ground truth, but it is correct nonetheless.
               Only rate the first figure, the second figure is only for reference.
               If the first figure is blank, that means the code failed to generate a figure. Give a score of 0 on the Plot correctness.
                After scoring from the above aspect, please give a final score. The final score is preceded by the [FINAL SCORE] token.
               For example [FINAL SCORE]: 40.''',
            },
            {
              "type": "image_url",
              "image_url": {
                "url": f"data:image/jpeg;base64,{base64_image2}",
              },
            },
            {
              "type": "image_url",
              "image_url": {
                "url": f"data:image/jpeg;base64,{base64_image1}",
              },
            },
          ],
        }
      ],
      max_tokens=1000,
    )
    pattern = r'\[FINAL SCORE\]: (\d{1,3})'


    # Create a dictionary to store settings and their scores
    match = re.search(pattern, response.choices[0].message.content)
    if match:
        score  = int(match.group(1)) / 100
    else:
        warnings.warn("No score found!!!")
        score = 0
    return score
Configuring the Optimizer#
We’ve created a search option for data visualization that searches over the following:
Chain-of-Thought reasoning
Planning before acting
2 few-shot examples
An ensemble of 3 agents for a task
# ================= Configure Search =================
from cognify.hub.search import datavis
search_settings = datavis.create_search(opt_log_dir='opt_results', evaluator_batch_size=50)
Begin Optimization#
The above code blocks are also provided in config.py. You can use Cognify’s CLI to start the optimization with
$ cognify optimize workflow.py
Alternatively, you can run the following cell (warning: this workflow may run for quite some time):
train, val, dev = load_data()

opt_cost, pareto_frontier, opt_logs = cognify.optimize(
    script_path="workflow.py",
    control_param=search_settings,
    train_set=train,
    val_set=val,
    eval_fn=gpt_4o_evaluate,
    force=True, # This will overwrite the existing results
)
Optimization Results#
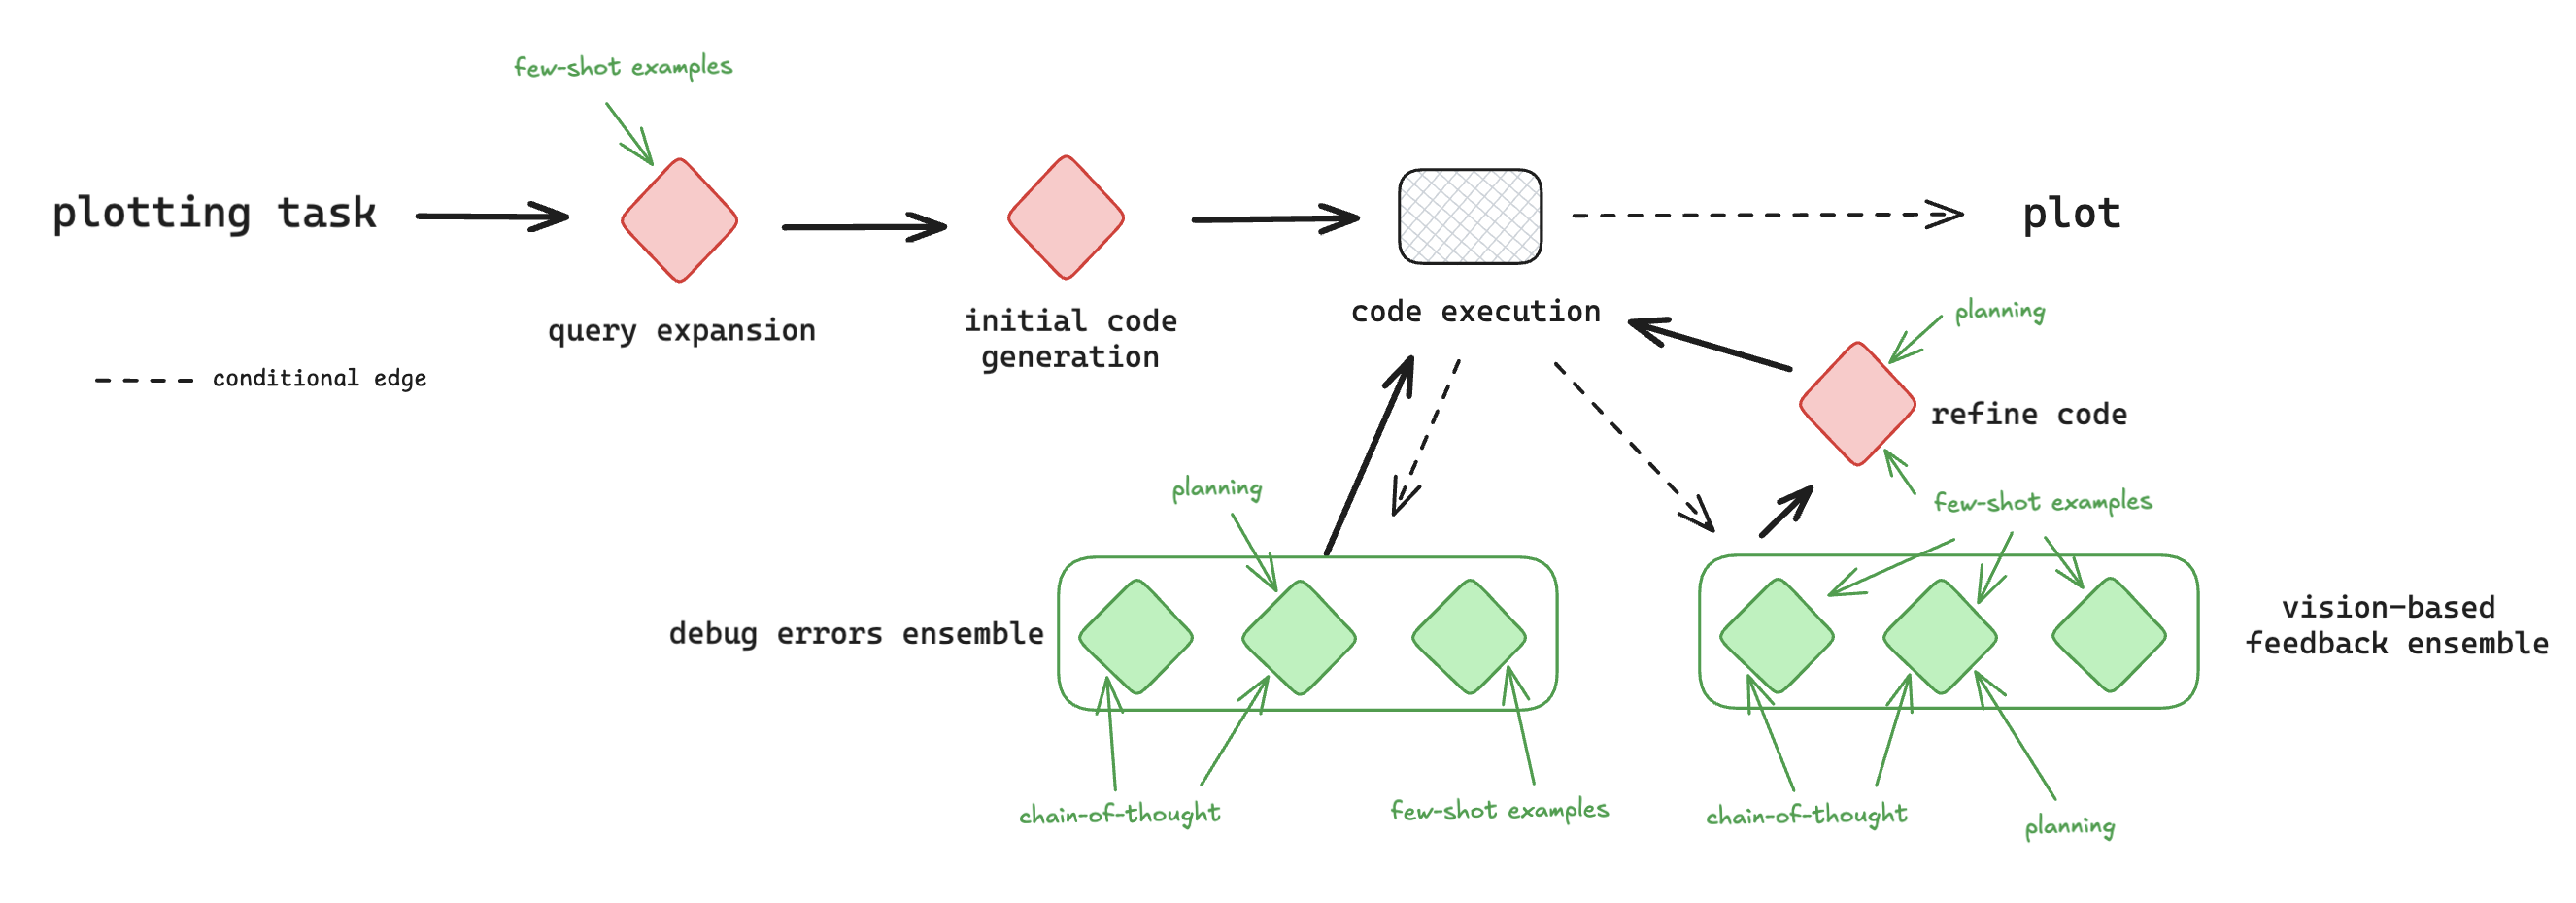
Cognfiy will output each optimized workflow to a .cog file. For this workflow, the optimizer applies the following optimizations to specific agents:
add few-shot examples to the query expansion agent
ensemble the debugging agent
add chain-of-thought to the first ensembled modules
add chain-of-thought and planning to the second ensembled module
add few-shot examples to the third ensembled module
ensemble the vision-based feedback agent
add few-shot examples to all the ensembled modules
add chain-of-thought to the first ensembled module
add chain-of-thought and planning to the second ensembled module
use few-shot examples and planning for code refinement
The final optimized workflow is depicted below, with optimizations highlighted in green.
Check out more details on how to interpret optimization results.